by Sunny | Nov 29, 2018 | 01 What's New, DNA
 Genealogy testing companies have been hard at work recalibrating your ethnicity calculations based on new and better data. Here’s the latest from Your DNA Guide Diahan Southard.
Family History DNA Pie Charts and Percentages
Remember that the pretty pie charts and percentages are based on fancy math and reference populations. The initial reference populations released by our testing companies were a great start, but many categories lacked sufficiently high numbers of people to represent all of the facets of a population. In the 10+ years since their release, many updates have been made. But the fancy math that is used to produce our percentages can only be as fancy as the numbers you give it. The numbers have been hard at work at Family Tree DNA, AncestryDNA and 23andMe in the past couple of months with the result being a major overhaul in the way our ethnicity results are reported.
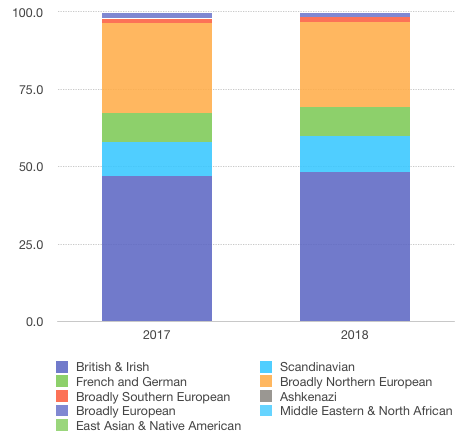
Image 1
23andMe
We recently reported about the update at 23andMe and their increase from 31 reference populations to 150. However, for me, the totally 100% European me, there wasn’t much excitement. As you can see in the 23andMe chart, I had a couple of numbers move up or down slightly, but not anything to write home about. However, I am certain those with South American, or Eastern European ancestry have a much different story. 23andMe added many new reference populations to better represent these underrepresented areas of the world, a move which has likely made a big difference for the ever diversifying pool of individuals who have taken a DNA test.
AncestryDNA
AncestryDNA also released their latest Ethnicity update in September, boasting an additional 13,000 reference samples to their database. They not only upgraded their numbers, but also shifted some of their categories around based on this new data. They seem to not be quite sure what to do with Ireland, as in early 2017 it was its own category, later moving in with Wales and Scotland, and now appears in this latest update as simply Ireland and Scotland. My previous numbers from AncestryDNA seemed to at least loosely reflect my heritage (meaning that I do actually have people in my genealogy chart from a few of these places).
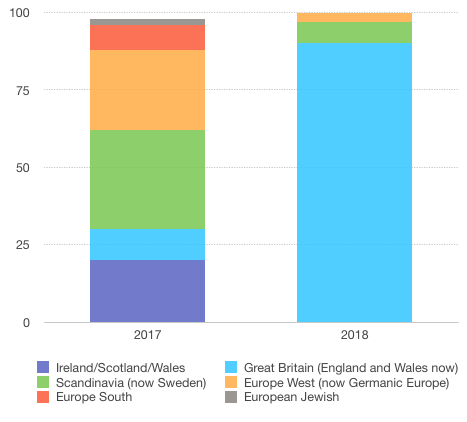
Image 2
But the new DNA numbers? Big Changes.
I have one set of great grandparents from Germany, but it looks like nearly all my German was sucked into England, but miraculously, they seemed to have precisely found my Swedish 2X great grandmother, with the 7% that I should have from that area.
With the new update, though I am sad to see my German go, AncestryDNA is now more fully in line with the results I have received from 23andMe, LivingDNA, and MyHeritage, all of which put my England/British Isles count up around 90%. If I compare my results from various companies and combine any subcategories into one England/British Isles category, indicate Scandinavian, and then lump everything else together, the results from the four companies are actually quite similar (I don’t have my own results at Family Tree DNA, only my parents).
My Family History DNA Results
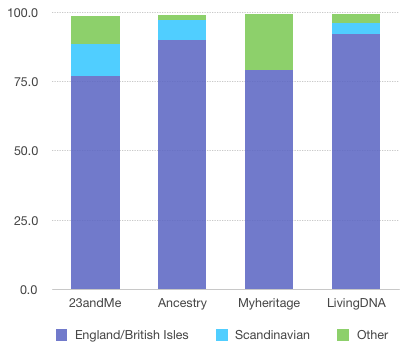
Image 3
Here’s how my results currently stack up at each of these websites. (Image 3)
Which DNA Testing Company to Choose
So which company is the best at all of this? Well, I usually say that if you test everywhere, your “true” answer is likely somewhere in the middle. But really, you can determine which company is best for you by examining their reference populations, and determining which company is most likely able to meet your goals.
In the end, it is always good to remember two things:
- Your DNA does not fully represent your family history, so your ethnicity results can’t possibly tell you everything about your heritage.
- This technology is purposefully titled as an estimate. So be sure you treat it that way.
Learn More about Genetic Genealogy
Recommended reading at Genealogy Gems: Understanding DNA Ethnicity Estimates
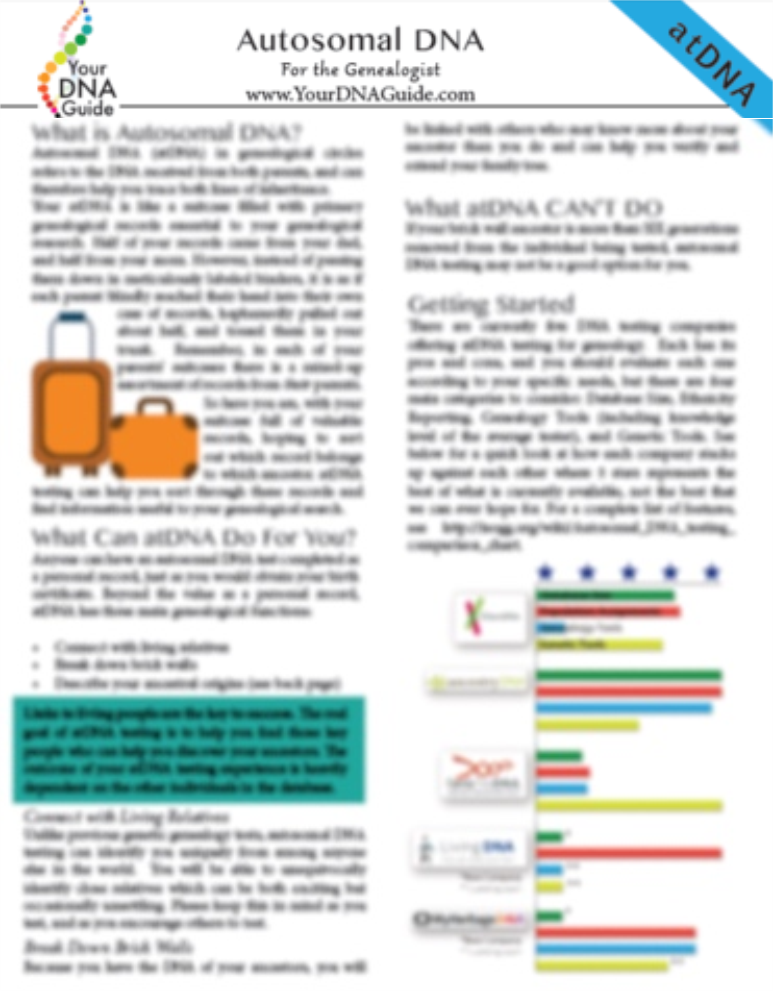
Get Diahan’s quick reference guides including Autosomal DNA for the Genealogist at the Genealogy Gems store.
by Diahan Southard | Jan 8, 2018 | 01 What's New, DNA
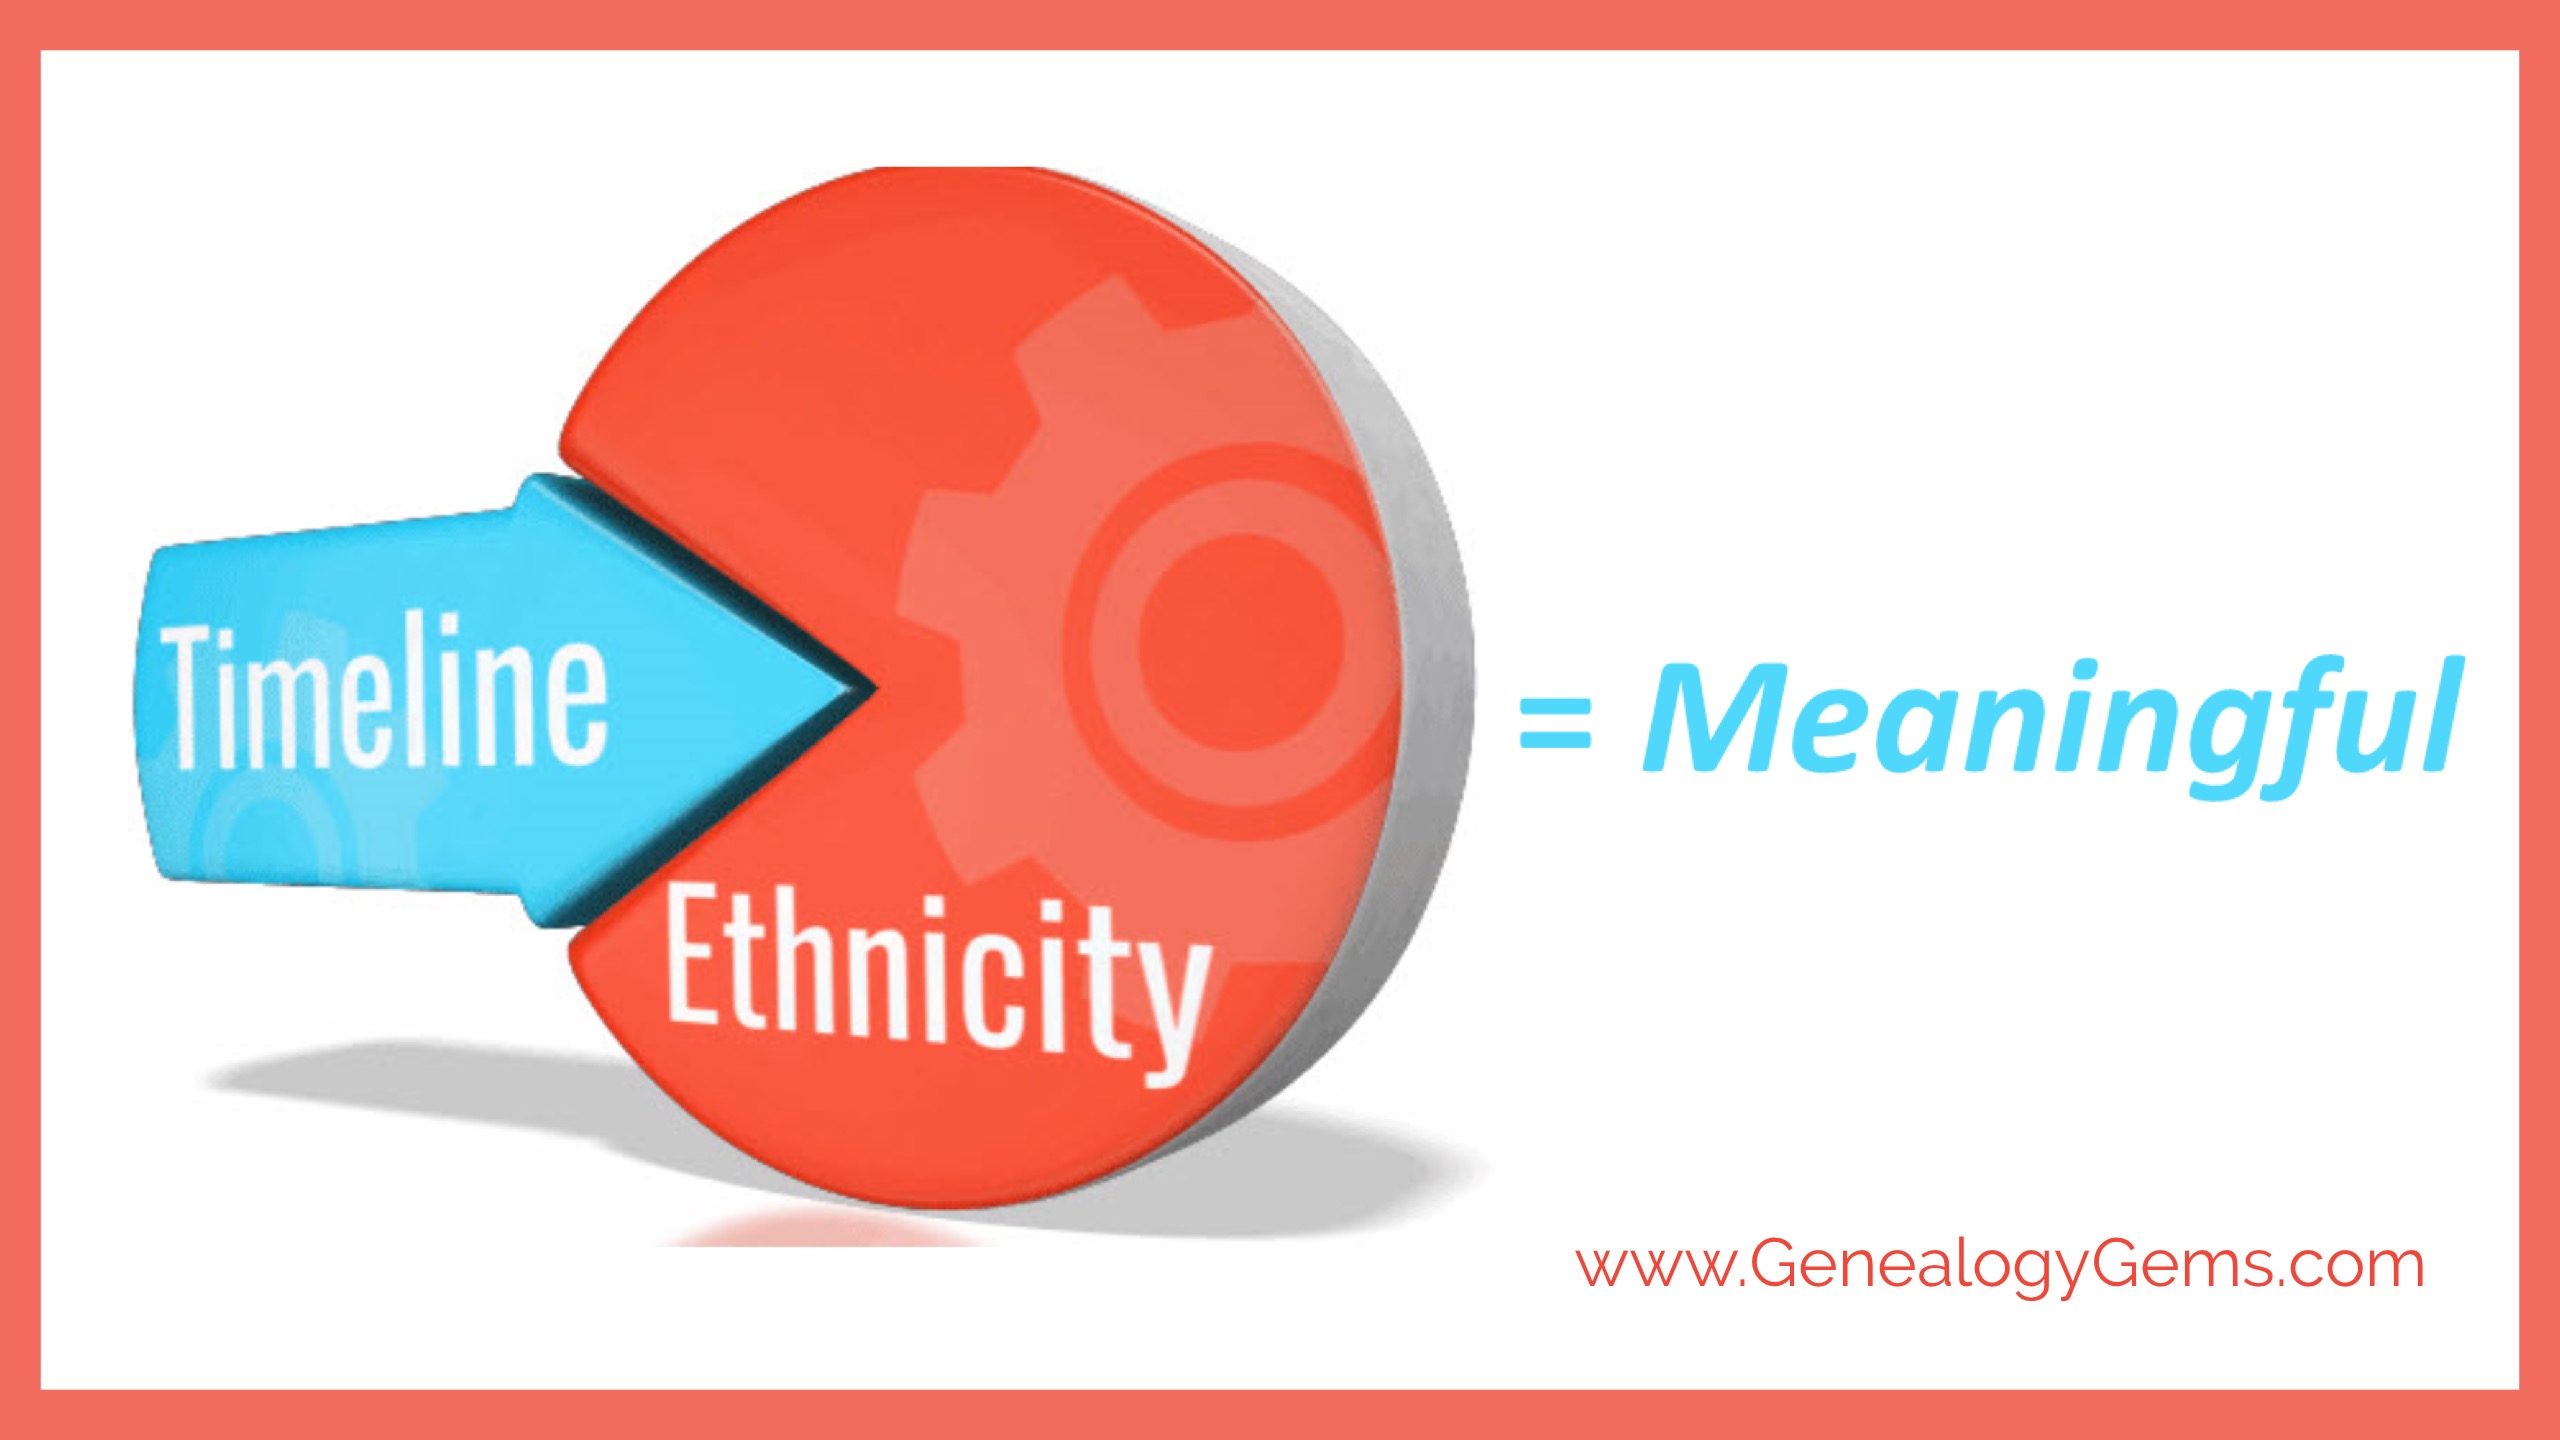
DNA ethnicity estimates are fun conversation-starters. But the “pie charts” become more meaningful genealogically when you can assign timelines to the places your ancestors were from. Here’s an update to our ongoing conversation about what DNA ethnicity results really mean.
Understanding DNA Ethnicity Estimates
Where did I come from? This is a fundamental human question, and it is driving millions of individuals all over the world to have their DNA tested. Now, we genealogists would like to think that they are being tested to aid their family history efforts, or to connect with us, their cousins. But they aren’t. They are after that pretty pie chart that tells them what percentage of themselves came from where.
Now, I know you have heard me say that these kinds of results are just for fun, and don’t hold much genealogical value. But due to some interesting developments in the world of DNA, my previous assertions of these ethnic origins results being somehow second class to our match list might be changing.
Living DNA and DNA Ethnicity Results
A U.K. company called Living DNA launched their DNA product in the fall of 2016. Right now, all they are focusing on is reporting ethnic origins information. But they are doing it in a manner that changes the way we look at our DNA ethnicity results.
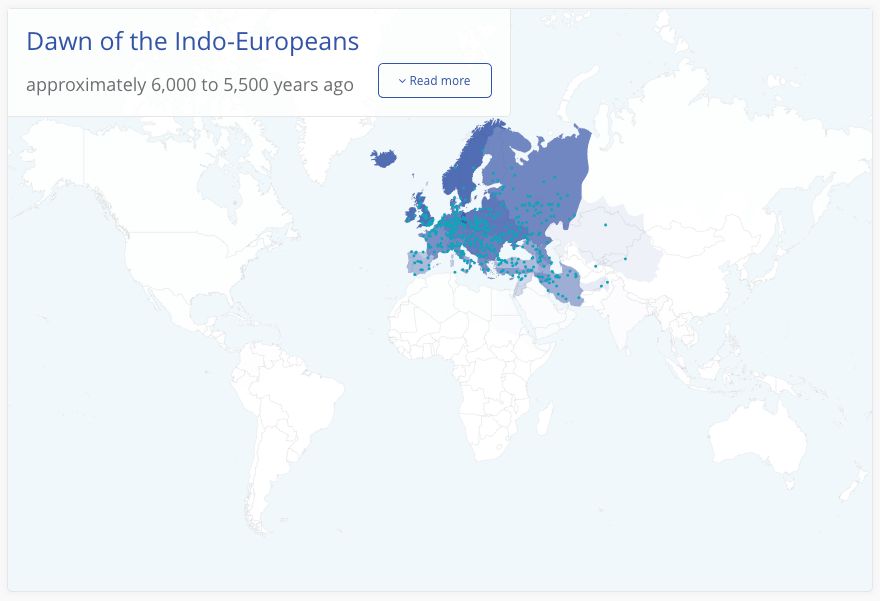
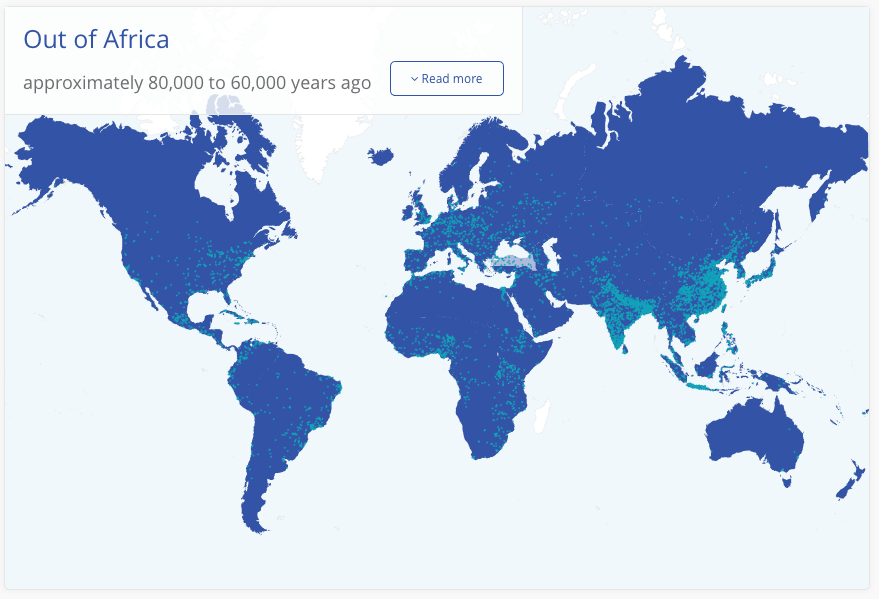
In addition to the standard map that you will see at any genetic genealogy company, Living DNA also offers a tool they call “Through History.” It literally takes you step-by-step back in time to show you how similar your DNA is to others on earth during 11 time periods ranging from 1,000 years ago to 80,000 years ago! In the images shown below, we see a glimpse into my earliest time period, a peek at the middle, and a view of the last. The intensity of the blue on the chart tells you how genetically similar I am to the people in that area.
In the first chart shown here, you can see that since I am 100% European, I share DNA with, well, people from Europe:
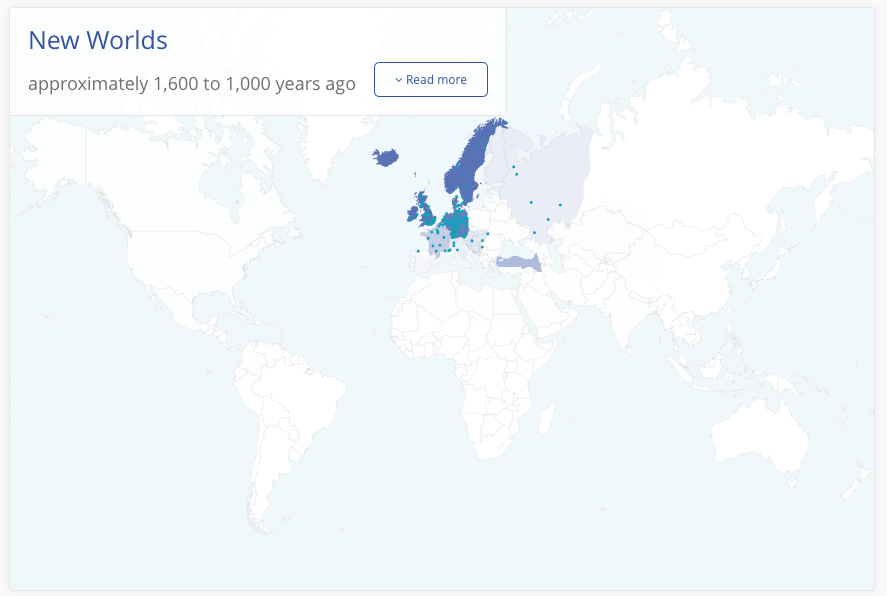
But, if we go back not very far, I am sharing DNA with people in the Middle East and Russia, as shown in the second map:
As my DNA marches further back in time I can see that I am sharing that DNA with people in a variety of locations, until we get back to the beginning of man, and I am sharing DNA with literally everyone in the world.
DNA Ethnicity Estimates Over Time
So, how does this work from a DNA standpoint? Well, the fact is, not all DNA markers are created equally. Some markers have developed relatively recently in on our timeline making them helpful for determining recent relationships and modern populations. Others have been around longer, linking us to early settlers of Europe or even Asia. Still others link us together as a human race and help to track our origins back to a single time and place.
Part of the struggle that these DNA testing companies have is trying to figure out the time and place for each of the markers they test. Certainly part of the puzzle is the ability to look not just at modern day populations, but ancient populations.
You may have heard of some recent reports that scientists have completed DNA testing on ancient remains. One example came from Ireland where they were able to determine that one body tested had ancestry in the Middle East, and another had roots in Russia. It is the combined efforts of both ancient DNA testing and your own modern samples that unite to help us improve our understanding of our own personal origins, as well help us understand how humankind developed and evolved.
3 Ways to Better Understand Your DNA Ethnicity Estimates
To get the most out of your genetic genealogy populations report, you may want to:
- View your results in the context of a more historical timeline, as opposed to your own genealogical timeline.
- Try testing at multiple companies (you can transfer into Family Tree DNA from 23andMe or AncestryDNA for only $19). Click here to see recent updates to Family Tree DNA’s ethnicity categories.
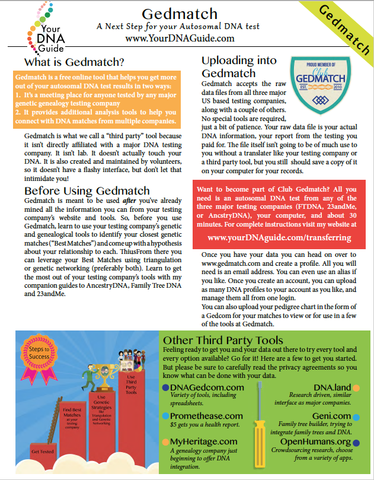
- Give the multiple population tools at Gedmatch a try, just to get a better feel for how different companies and tools can provide us a different look at the populations we are carrying around in our DNA. My quick guide for using Gedmatch, shown here, is available as a printed guide or digital download.
Your DNA Guide
Diahan Southard is Your DNA Guide here at Genealogy Gems. She been in the genetic genealogy industry since it has been an industry, having worked with the Sorenson Molecular Genealogy Foundation. She holds a degree in Microbiology and her creative side helps her break the science up into delicious bite-sized pieces for you. She’s the author of our popular DNA guide series, which includes Getting Started: Genetics for Genealogists and Y Chromosome DNA for Genealogists (find the full series in the Genealogy Gems Store).