by Lisa Cooke | Mar 30, 2019 | 01 What's New, Ancestry, DNA
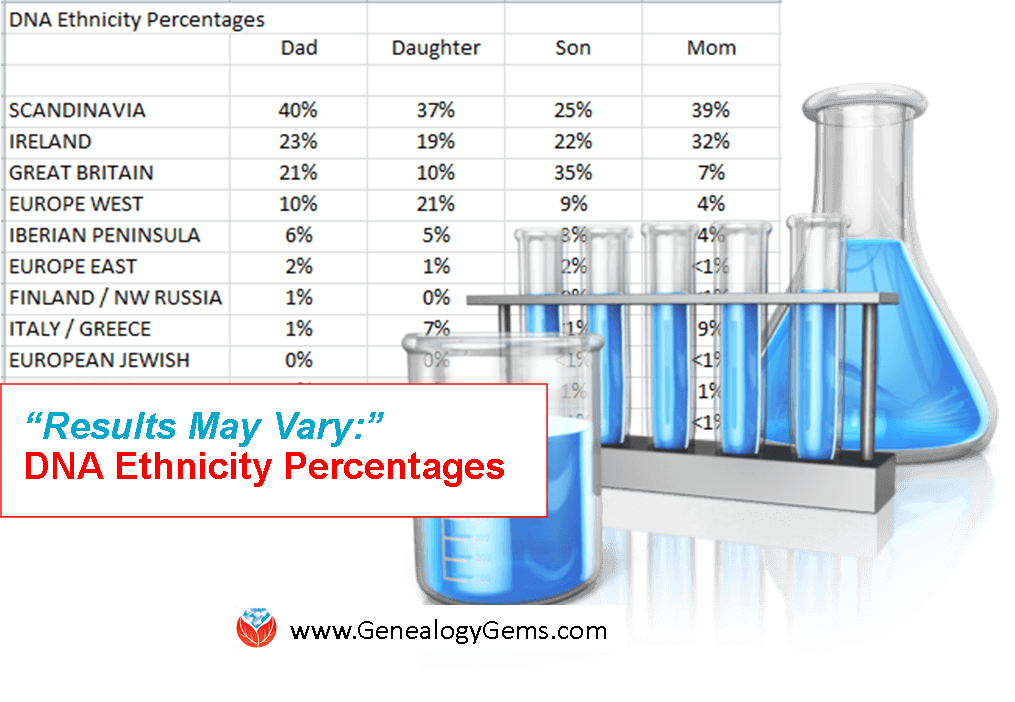
Four members of a family–mom, dad, daughter, and son–tested with AncestryDNA. Their DNA ethnicity percentages vary. Why?
If you’ve taken a DNA test and received different ethnicity results than you expected and different from your family members, DNA expert Diahan Southard is here to explain why that happens.
There are limitations to the ethnicity results delivered by the various DNA testing companies.
For the most part, these admixture results are like that short film before the actual feature presentation. That feature presentation, in this case, is your genealogical match list. But, the short film is entertaining and certainly keeps your attention for a while. It can be especially interesting when you have several members of the same family tested so you can compare their ethnicity results.
Understanding Ethnicity Variance Within Immediate Families
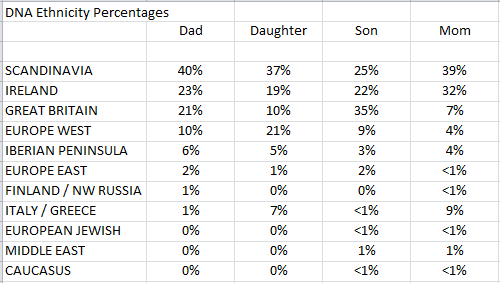
Let’s consider the real AncestryDNA test results of a family we’ll call the “Reese family:”
The Reese family has something to their great advantage: their family history indicates that they are mostly from Western Europe. This is a big advantage in the climate of today’s ethnicity results as all of the testing companies have far more data in their reference populations pouring out of western Europe than from anywhere else. (See this article for more information and the latest data on DNA reference populations on each testing company.) That means that in general, they are going to be better at telling you about your heritage from Ireland or England than they are at discovering that you are from China or India.
Looking at the ethnicity results for the Reese family, we are tempted to start applying our knowledge of DNA inheritance to the numbers we see. We know that each child should get half of their DNA from their mom and half from their dad. So our initial reaction might be to look at the dad’s 40% Scandinavian and mom’s 39% Scandinavian and assume that the child would also be about 40% (20% from dad and 20% from mom).
You can see that the daughter did, in fact, mostly measure up to that expectation with 37% Scandinavian. But the son, with only 25%, seems to have fallen short. The temptation to consider the daughter as the far better example of familial inheritance is strong (especially for us daughters, who are so often exceeding expectations!), but of course inaccurate. It is actually very difficult to look at the parent’s numbers alone and estimate the percentages that a child will receive.
A Snippet about SNPs (snips)
Remember that these numbers are tied to actual small pieces of DNA we call SNPs (snips).
Of the near 800,000 SNPs evaluated by your testing company, less than half of them are considered valuable for determining your ethnicity.
The majority of the SNPs tested are working to estimate how closely you are related to your genealogical cousin.
A good SNP for ethnicity purposes has to be ubiquitous enough to show up in many individuals from a given population, but unique enough to only show up in that population, and not any others.
It is a difficult balance to strike. But even when good SNPs are used, it is still difficult for the computer at your testing company to make accurate determinations about your ancestry.
New to using DNA for genealogy? Watch:
(Click on player to unmute sound)
Take the Great Britain line in the Reese family data, for example. The dad has 21% and the mom has 7%, so it would follow that the largest amount any child could have would be 28%. We see the daughter (of course!) falling well within that range at 10%, but the son is seven points above at 35%. How does THAT happen?!
Let’s go back to some basic biology.
Remember that you have two copies of each chromosome: one from mom and one from dad. These chromosomes are made up of strings of letters denoting the DNA code. That means that at each SNP location, you report two letters (again, one from mom and one from dad).
As the testing company is lining these letters up for comparison, they have to decide which letters go together: which are from the same chromosome and which set came from one single source.
Understanding Phasing
The process of determining which set of values goes on which line is called phasing. Often the inconsistencies you see in your DNA test results, whether it be in the matching or in the ethnicity, are because of problems the company has with this very difficult process.
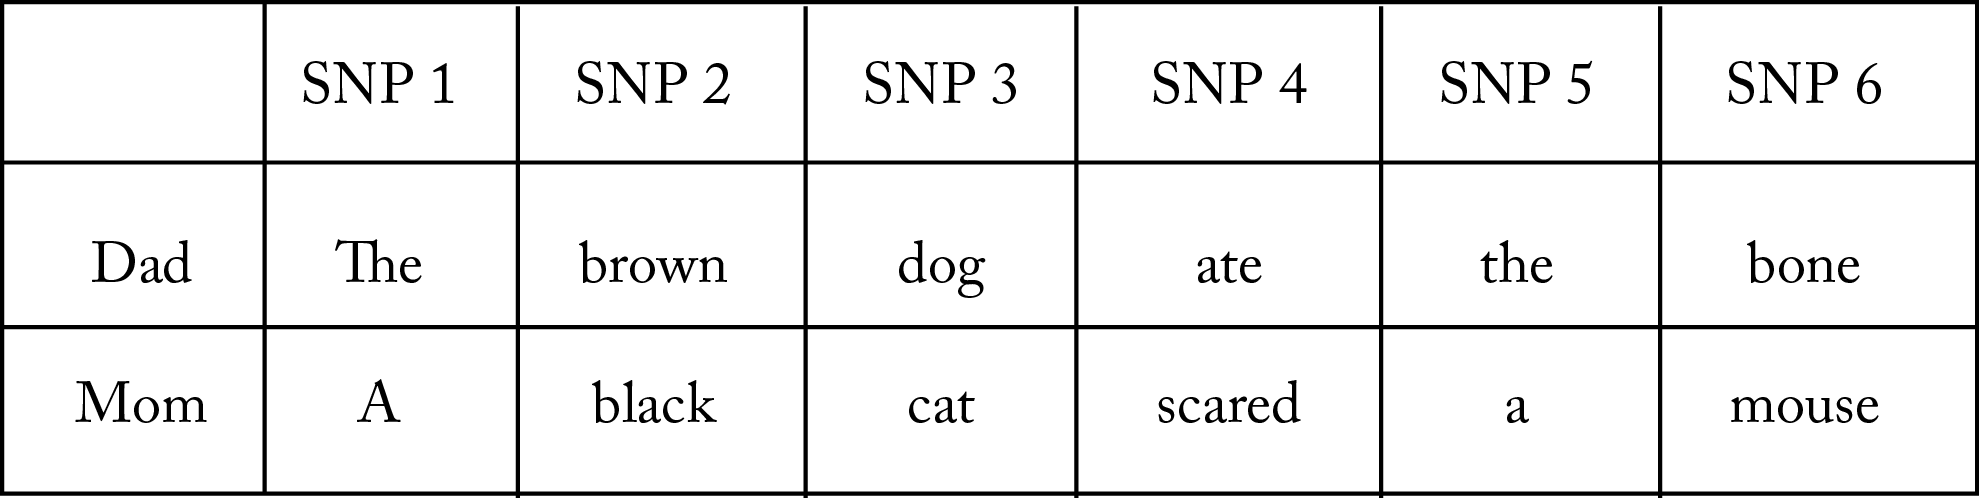
To illustrate how this works, let’s say we are trying to write two sentences: “The brown dog ate the bone.” and “A black cat scared a mouse.”
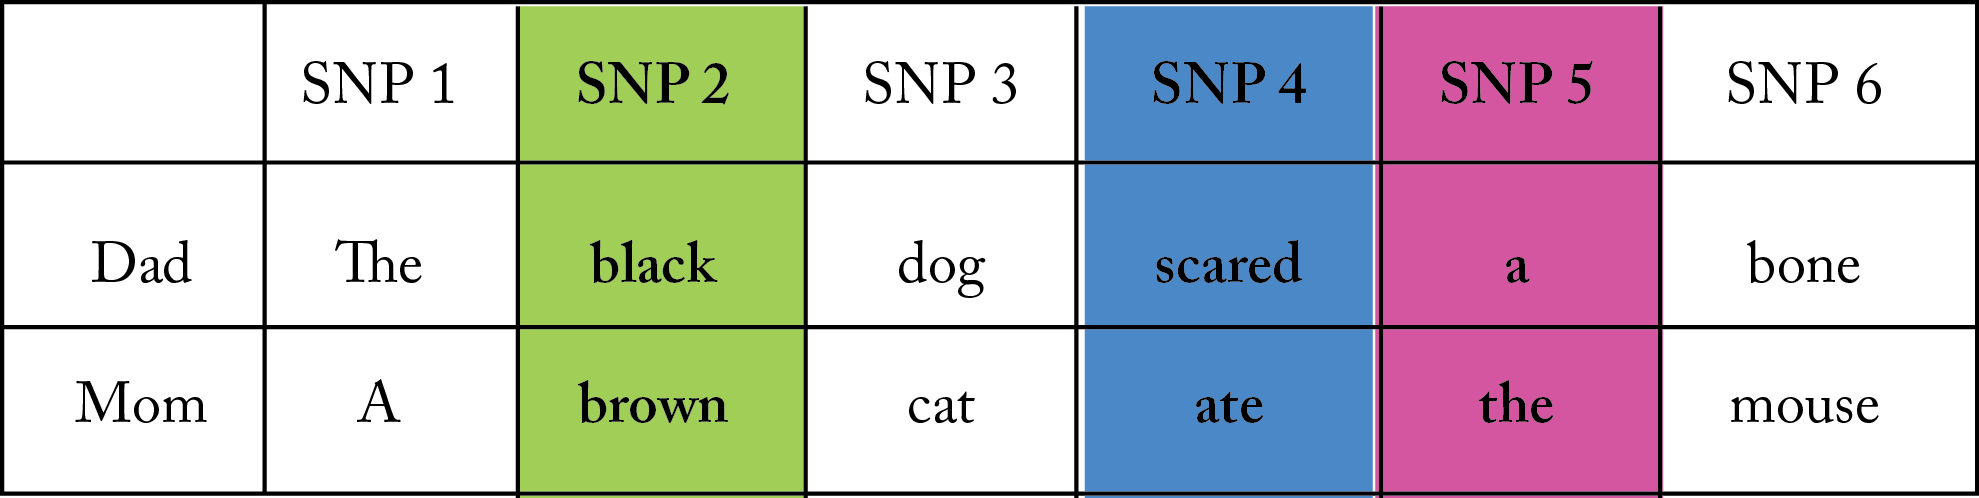
In this example, each word in each sentence represents a SNP. However, all the computer sees are two words, and it doesn’t know which word goes in which sentence. You can see in this example that it would be fairly easy to get it wrong. Mixing up a couple of words creates entirely new sentences with very different meanings, as shown in the examples below.
It’s important to understand that ethnicity results can, and will, vary among family members as well as different DNA testing companies for the reasons outlined above.
It can certainly be fun to compare what each family member received, but take it with a grain of salt. As you can see, a lot of genetic data is quickly lost over time.
In the Reese family example, we see that in one single generation this family has lost all traces of ancestry to several world regions. This really highlights the value of having the oldest generation of family members tested, to try to capture all that they have to offer in their DNA code.
Get more DNA help and plain-English explanations
If you’re feeling overwhelmed by DNA testing or struggling to make sense of the complex scientific data, our quick reference guides are exactly what you need!
Author and DNA expert Diahan Southard’s collection of DNA guides offer explanations in plain-English, helpful examples and graphics, and practical genealogical applications so you can make the most of your DNA results. Head over to the Genealogy Gems Store to browse our 10 DNA guides available in both print and digital download.
About the Author: Diahan Southard has worked with the Sorenson Molecular Genealogy Foundation, and has been in the genetic genealogy industry since it has been an industry. She holds a degree in Microbiology and her creative side helps her break the science up into delicious bite-sized pieces for you. She’s the author of a full series of DNA guides for genealogists.
Disclosure: This article contains affiliate links and Genealogy Gems will be compensated if you make a purchase after clicking on these links (at no additional cost to you). Thank you for supporting Genealogy Gems!
This article was originally published on February 28, 2016 and updated on March 30, 2019.
by Diahan Southard | Jan 8, 2018 | 01 What's New, DNA
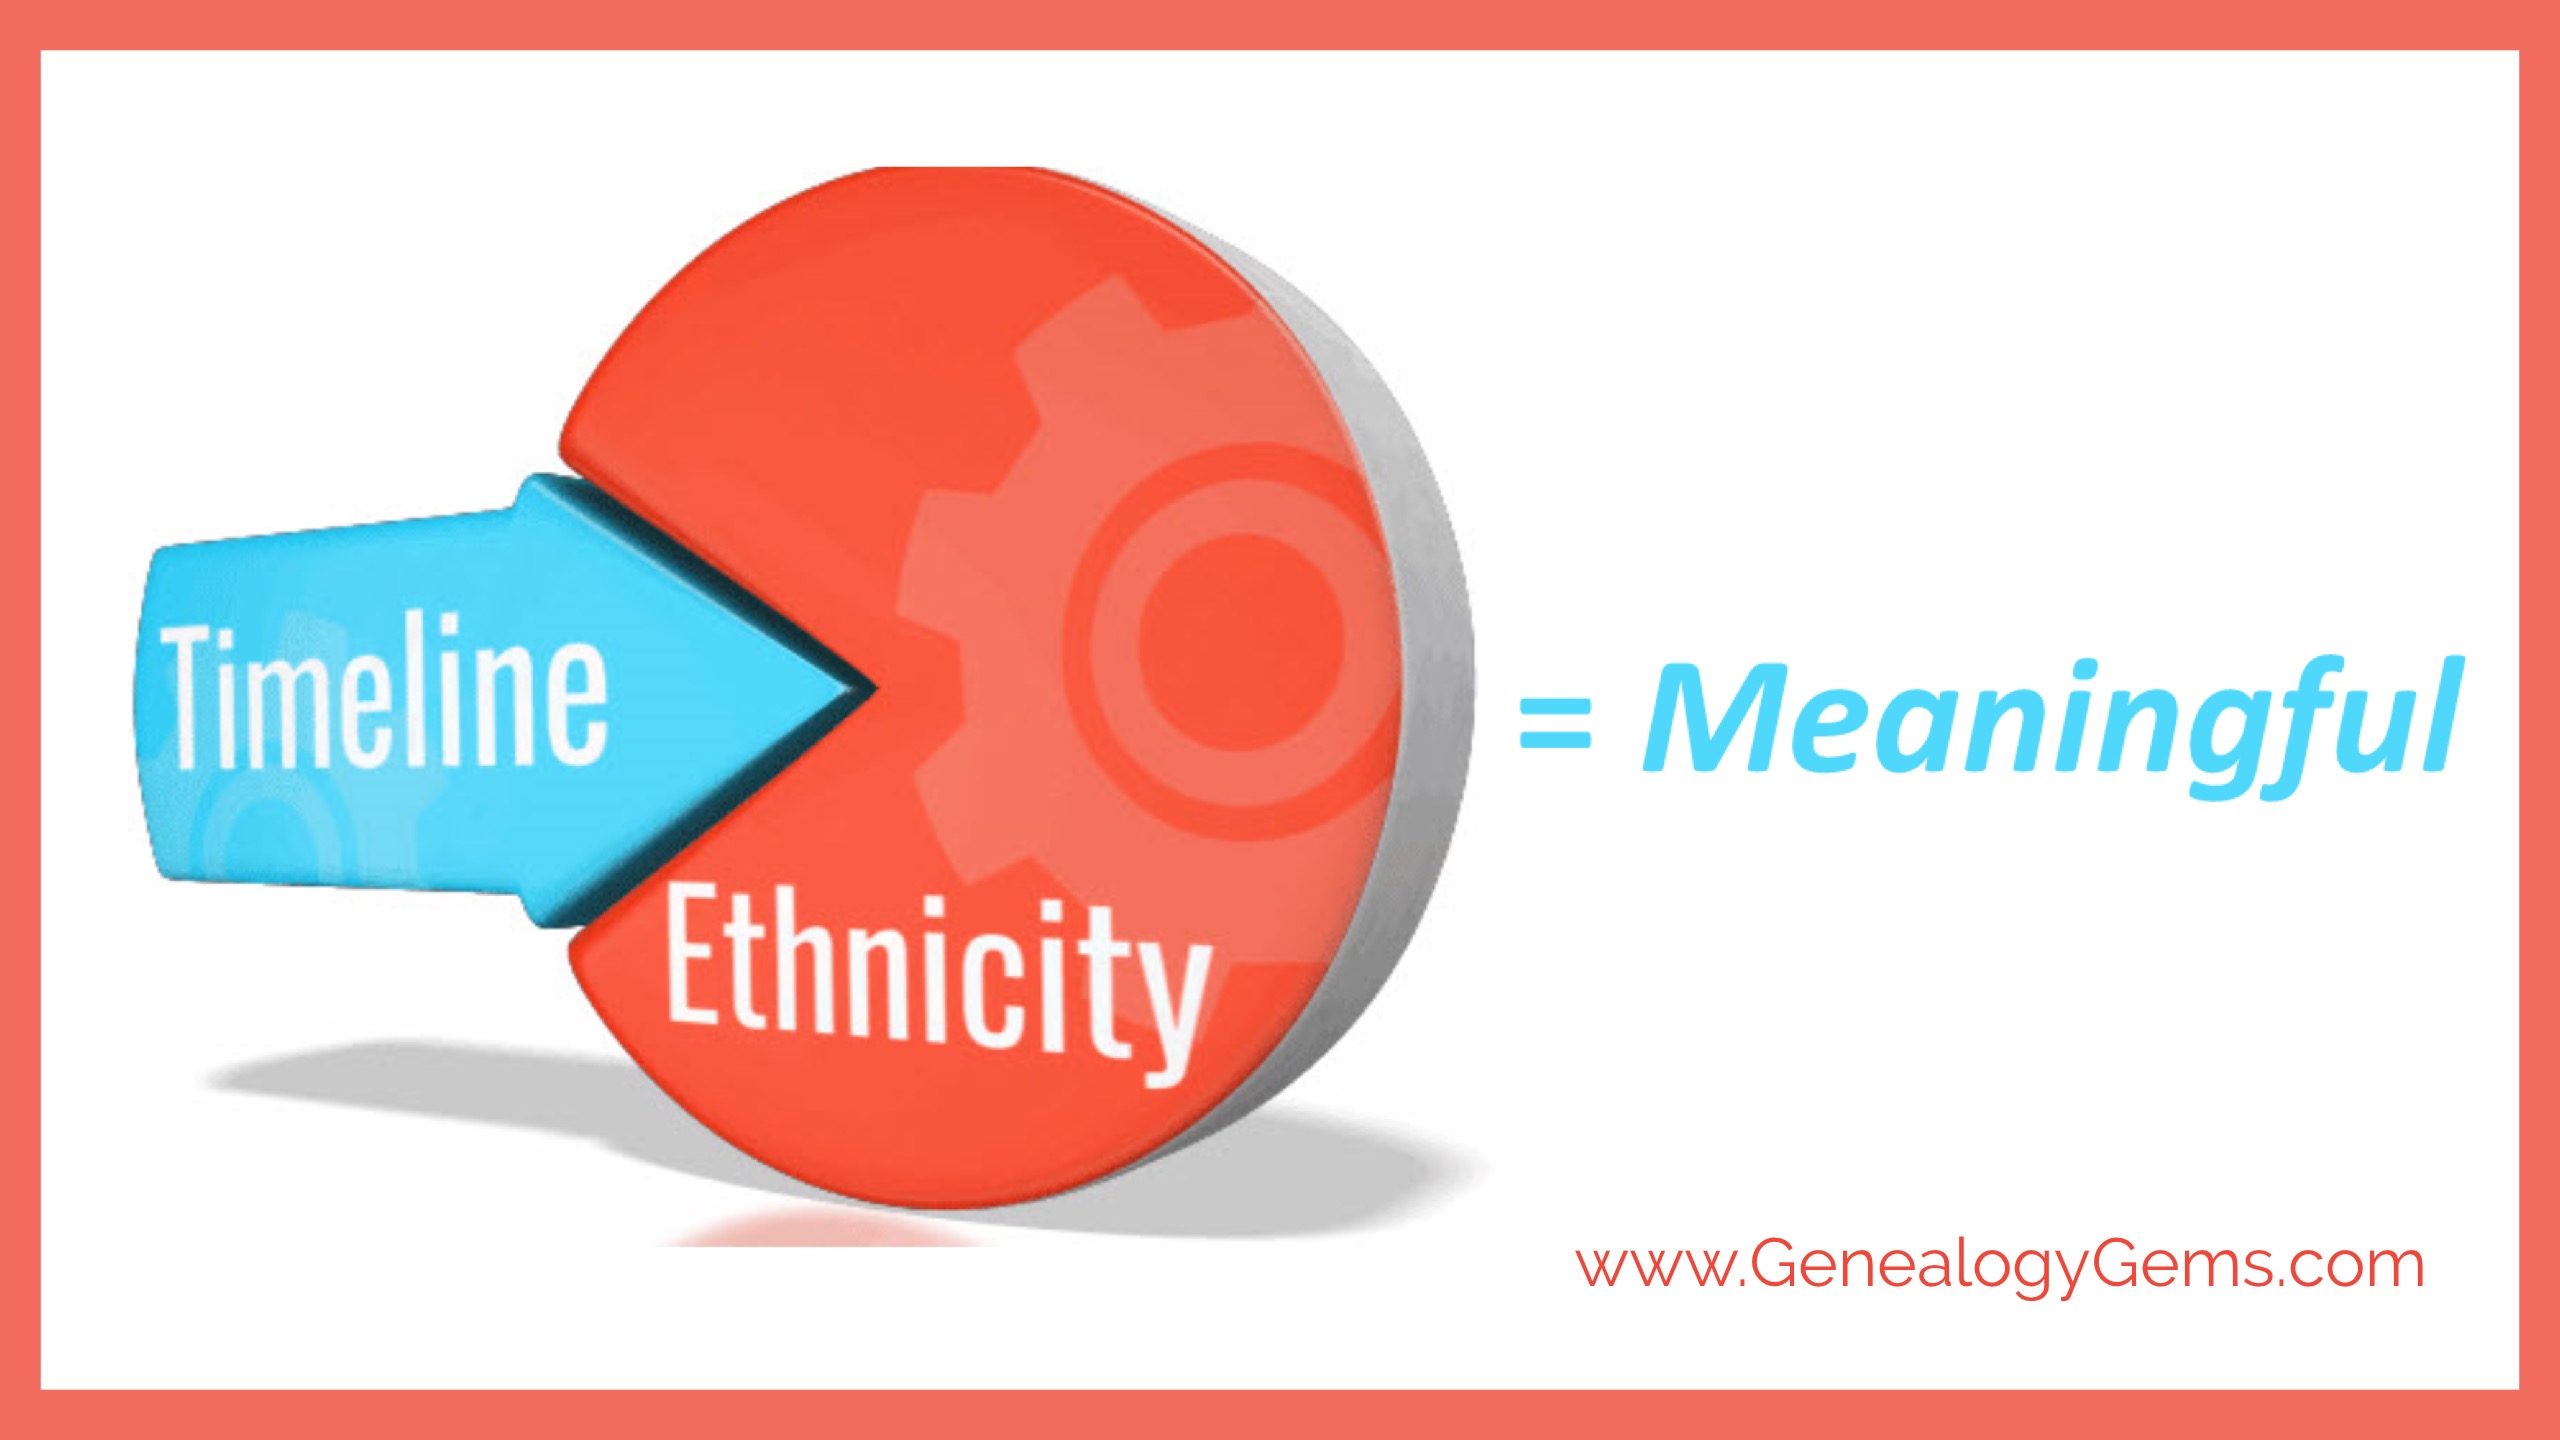
DNA ethnicity estimates are fun conversation-starters. But the “pie charts” become more meaningful genealogically when you can assign timelines to the places your ancestors were from. Here’s an update to our ongoing conversation about what DNA ethnicity results really mean.
Understanding DNA Ethnicity Estimates
Where did I come from? This is a fundamental human question, and it is driving millions of individuals all over the world to have their DNA tested. Now, we genealogists would like to think that they are being tested to aid their family history efforts, or to connect with us, their cousins. But they aren’t. They are after that pretty pie chart that tells them what percentage of themselves came from where.
Now, I know you have heard me say that these kinds of results are just for fun, and don’t hold much genealogical value. But due to some interesting developments in the world of DNA, my previous assertions of these ethnic origins results being somehow second class to our match list might be changing.
Living DNA and DNA Ethnicity Results
A U.K. company called Living DNA launched their DNA product in the fall of 2016. Right now, all they are focusing on is reporting ethnic origins information. But they are doing it in a manner that changes the way we look at our DNA ethnicity results.
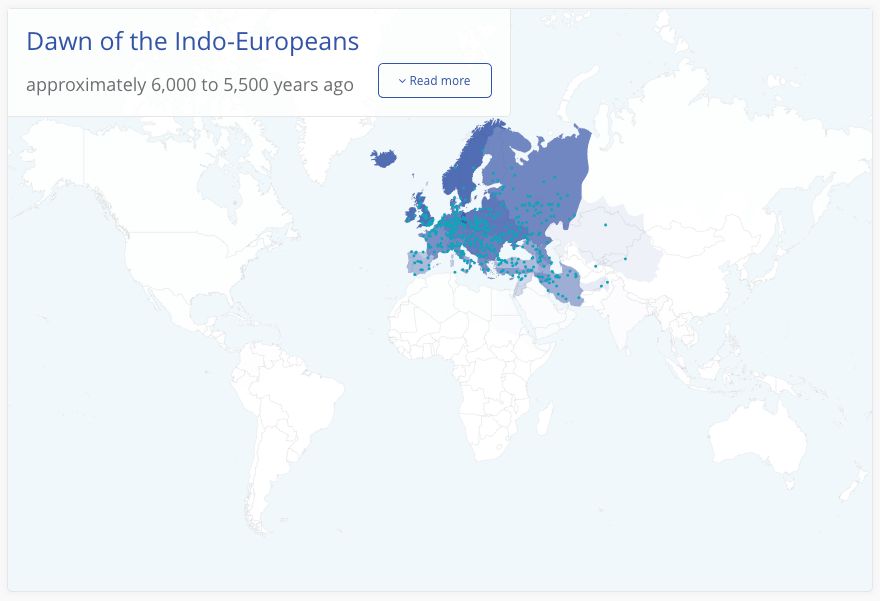
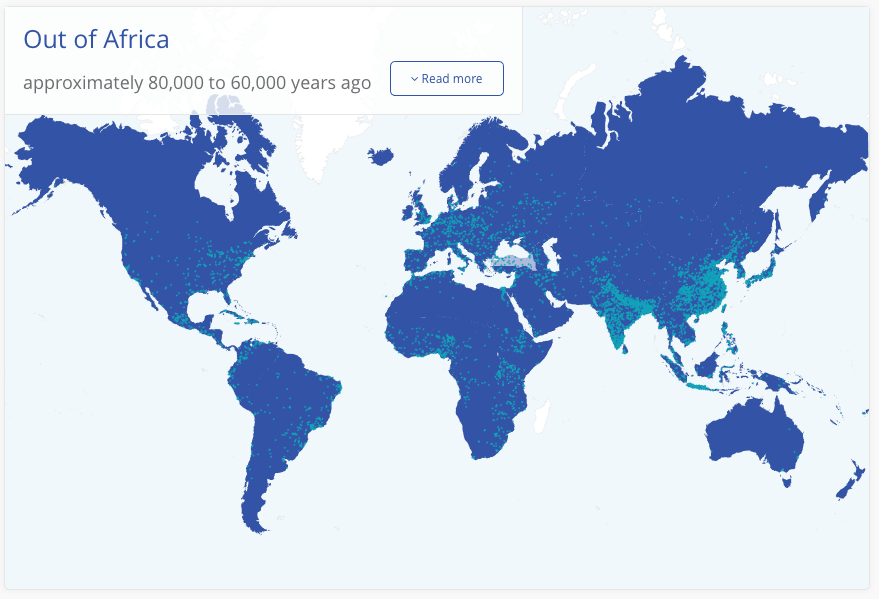
In addition to the standard map that you will see at any genetic genealogy company, Living DNA also offers a tool they call “Through History.” It literally takes you step-by-step back in time to show you how similar your DNA is to others on earth during 11 time periods ranging from 1,000 years ago to 80,000 years ago! In the images shown below, we see a glimpse into my earliest time period, a peek at the middle, and a view of the last. The intensity of the blue on the chart tells you how genetically similar I am to the people in that area.
In the first chart shown here, you can see that since I am 100% European, I share DNA with, well, people from Europe:
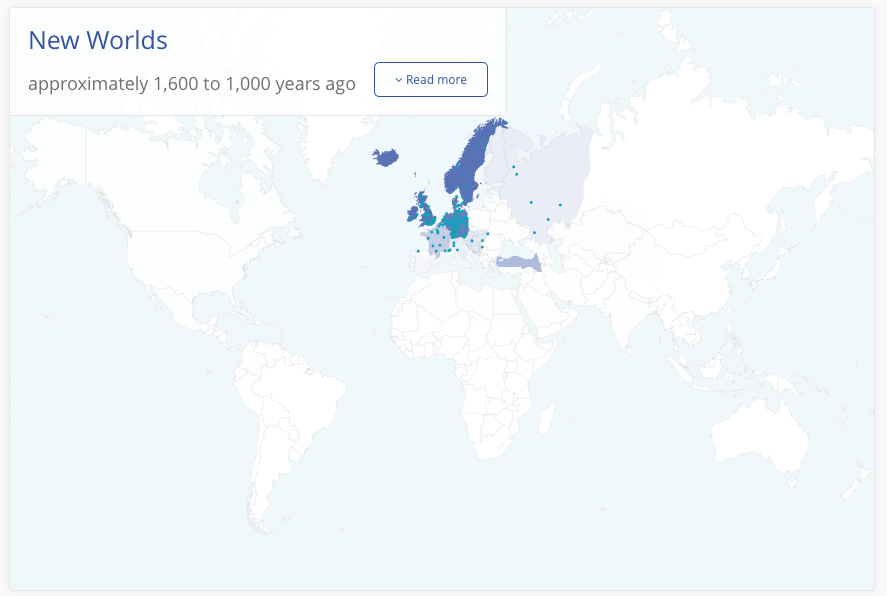
But, if we go back not very far, I am sharing DNA with people in the Middle East and Russia, as shown in the second map:
As my DNA marches further back in time I can see that I am sharing that DNA with people in a variety of locations, until we get back to the beginning of man, and I am sharing DNA with literally everyone in the world.
DNA Ethnicity Estimates Over Time
So, how does this work from a DNA standpoint? Well, the fact is, not all DNA markers are created equally. Some markers have developed relatively recently in on our timeline making them helpful for determining recent relationships and modern populations. Others have been around longer, linking us to early settlers of Europe or even Asia. Still others link us together as a human race and help to track our origins back to a single time and place.
Part of the struggle that these DNA testing companies have is trying to figure out the time and place for each of the markers they test. Certainly part of the puzzle is the ability to look not just at modern day populations, but ancient populations.
You may have heard of some recent reports that scientists have completed DNA testing on ancient remains. One example came from Ireland where they were able to determine that one body tested had ancestry in the Middle East, and another had roots in Russia. It is the combined efforts of both ancient DNA testing and your own modern samples that unite to help us improve our understanding of our own personal origins, as well help us understand how humankind developed and evolved.
3 Ways to Better Understand Your DNA Ethnicity Estimates
To get the most out of your genetic genealogy populations report, you may want to:
- View your results in the context of a more historical timeline, as opposed to your own genealogical timeline.
- Try testing at multiple companies (you can transfer into Family Tree DNA from 23andMe or AncestryDNA for only $19). Click here to see recent updates to Family Tree DNA’s ethnicity categories.
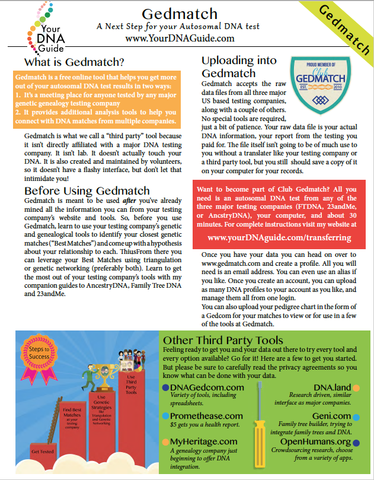
- Give the multiple population tools at Gedmatch a try, just to get a better feel for how different companies and tools can provide us a different look at the populations we are carrying around in our DNA. My quick guide for using Gedmatch, shown here, is available as a printed guide or digital download.
Your DNA Guide
Diahan Southard is Your DNA Guide here at Genealogy Gems. She been in the genetic genealogy industry since it has been an industry, having worked with the Sorenson Molecular Genealogy Foundation. She holds a degree in Microbiology and her creative side helps her break the science up into delicious bite-sized pieces for you. She’s the author of our popular DNA guide series, which includes Getting Started: Genetics for Genealogists and Y Chromosome DNA for Genealogists (find the full series in the Genealogy Gems Store).
by Lisa Cooke | Nov 24, 2015 | 01 What's New, British, DNA, Irish, Listeners & Readers
Are your DNA ethnicity results exciting, confusing, inconsistent, exasperating…or all of the above?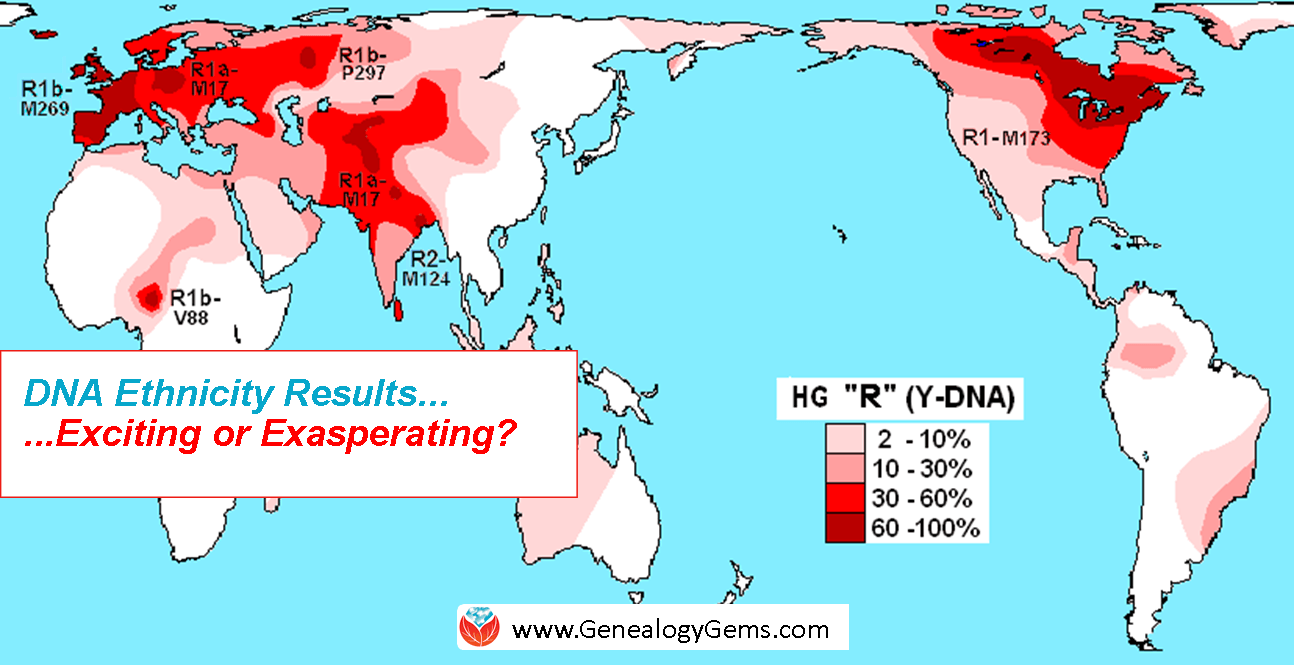
Recently Kate expressed on the Genealogy Gems Facebook page her frustration with her ethnicity results provided by AncestryDNA. She gets right to the point when she writes, “the way they refer to the results is confusing.”
Kate, you are not alone. Many genealogists have been lured into taking the autosomal DNA test at one of the three major DNA testing companies just to get this glimpse into their past. Remember that the autosomal DNA test can reveal information about both your mother’s side and your father’s side of your family tree. Many take the test hoping for confirmation of a particular ancestral heritage, others are just curious to see what the results will show. Though their purposes in initiating the testing may vary, the feeling of bewilderment and befuddlement upon receiving the results is fairly universal.
Kate has some specific questions about her results that I think most will share. Let’s take a look at a couple of them. First up, Kate wants to know if our family tree data in any way influences the ethnicity results provided. The answer is an unequivocal “no.” None of the testing companies look at your family tree in any way when determining your ethnicity results. However, the results are dependent on the family trees of the reference population. The reference populations are large numbers of people whose DNA has been tested and THEIR family history has been documented for many generations in that region. The testing companies compare your DNA to theirs and that’s how they assign you to an ethnicity (and place of ancestral origin?).
Next Kate asks, “Do they mean England when they report Great Britain?” Or to put it more broadly, how do these testing companies decide to divide up the world? All of the companies handle this a little bit differently. Let’s look at Ancestry as an example. When you login to view your ethnicity results, you can click on the “show all regions” box below your results to get a list of all of the possible categories that your DNA could be placed in. These 26 categories include nine African regions, Native American, three Asian regions, eight European regions, two Pacific Island regions, two West Asian regions, and then Jewish, which is not a region, per se, but a genetically distinct group.
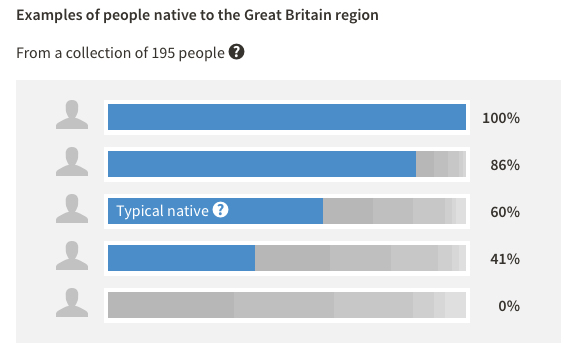
Clicking on each individual location in the left sidebar will bring up more information on the right about that region. For example, clicking on Great Britain tells us that DNA associated with this region is primarily found in England, Scotland, and Wales, but is also found in Ireland, France, Germany, Denmark, Belgium, Netherlands, Switzerland, Austria, and Italy. Basically, this is telling us that people with generations of ancestry in Great Britain are quite a genetic mix from many areas.
The first chart here shows that if we are to test the DNA of 100 natives of one of these primary regions (England, Scotland or Wales) then 50 of them willhave the great Britain “pattern” of DNA covering 60% or more of their entire genome, and 50 of them will have that pattern in less than 60% of their DNA. The fact that this half-way number is so low, only 60%, tells us that there is a lot of uncertainty in this ethnicity estimate because there is so much mixture in this region. Kate, for you that means that when you see Great Britain in your ethnicity estimate, it could mean England, or maybe it means Italy- Ancestry can’t be certain.
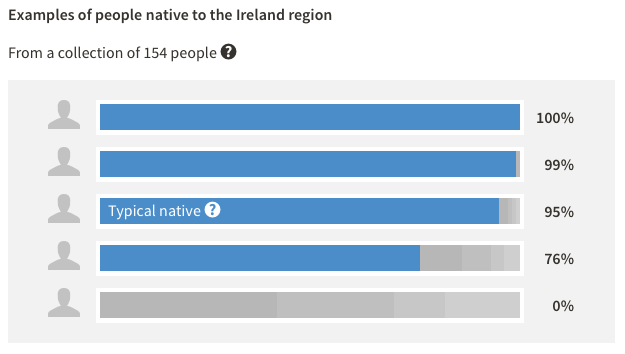
But that uncertainty isn’t the same for every region. Pictured here is also the ethnicity chart for Ireland. You can see that half the people who are native to Ireland will have 95% or more Irish DNA. Kate, for us this means that if you have Irish DNA in your results, you can be pretty certain it came from Ireland. From these tables you can see your membership in some regions is more robust than others, and Ancestry is using these tables to try to help us tell the difference.
In the end, the ethnicity results reported by each DNA testing company are highly dependent on two factors: the reference populations they use to compare your DNA against, and the statistical algorithms they use to compute your similarities to these populations. Every company is doing both of these things just a little bit differently.
Kate, if you want to get another take on your ethnicity results, you can take your data over to Family Tree DNA, or you can be tested at 23andMe. A free option is to head over to Gedmatch and try out their various ethnicity tools. If you need help downloading and transferring, you can head over to my website: http://www.yourdnaguide.com/transferring. Most people have found after searching in multiple places that their “true” results are probably somewhere in the middle.
While these ethnicity results can be interesting and useful, for most they will just be a novelty; something interesting and exciting. I have found that their most useful application is acting like a fly on a fishing line. They attract our family members into DNA testing where we can then set the hook on the real goal: family history.
If you’re ready to bait your own hook, I recommend you check out my series of DNA quick guides. These guides will help you choose the right DNA tests for your genetic genealogy questions. You’ll become a smart shopper, more prepared to choose the testing company that’s right for you. And you’ll be prepared to maximize your results from each company, rather than look at them blankly and wondered what the heck you just spent that money on. Click here to see all my DNA guides: I recommend the value-priced bundle!
Disclosure: This article contains affiliate links and Genealogy Gems will be compensated if you make a purchase after clicking on these links (at no additional cost to you). Thank you for supporting Genealogy Gems!